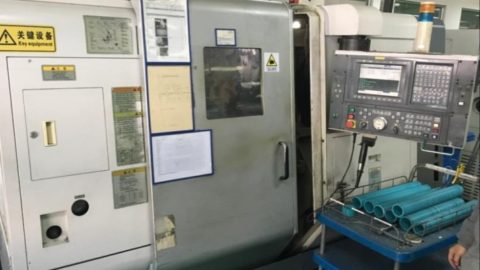
CNC machine at the PTFE resin factory
Once the current status of the equipment and the location for improvement have been identified, experts will use the observed data to calculate pre-improvement OEE. In this step, the researcher selected three-month data from the previous year and calculated the initial OEE of the selected machines. These data are compared with data after the self-managed maintenance was applied.
Accordingly, an operator training schedule should be developed to prepare for the intensive training step. A checklist titled “Daily check-in and check-in checklist” has been created to guide daily operations in cleaning and checking. During the training period, a standardized procedure for cleaning, testing and monitoring was created with the input of experienced operators, maintenance technicians and engineers involved. The operator then performs these operations.
After the preparation phase is complete, the operator begins to perform a daily inspection based on the baseline conditions of all equipment established and the checklist and daily cleaning. Next, the actual OEE is calculated based on the current historical record. Second, the operator monitors the OEE of each machine every week since the beginning of the TPM method. Operator recorded any time losses during work and imported them into Excel forms.
After applying all the steps, the team reviewed the response-based daily checklist. The OEE recording period is divided into two phases, known as before implementing the AM approach and after implementing the AM approach. In this study, the tools described previously assisted participants in applying TPM measures to PTFE plant processes.
Results of TPM adoption:
– The OEE index of the No.1 CNC machine in 2016 before AM deployment was 82.7% and 2017 after AM implementation was 83.8%. The increase is about 1.1%. Planned production time increased from 30,080 minutes to 30,225 minutes. The breakdown time in 2016 was 60 minutes, while it was 0 in 2017.
– Setting time increased from 2,853 minutes to 2,926 minutes. Setup time refers to the time the operator adjusts the running parameters of the machine to achieve the product quality standards. PF & D time (time for personal activities, fatigue and delays according to the US Department of Labor, 2008) was reduced from 665 minutes to 650 minutes. Running time increased from 26,502 minutes to 26,649 minutes. Total products increased from 100,956 units to 102,516 units. Defects decreased from 1,477 units to 1,255 units.
Productivity and Quality Office